Study case 1
In this example we will study a set of motifs dicovered in a ChIP-seq experiment done for the TF Oct4 (Pou5f1) which is an essential TF in cell fate decision, ES cells and early embryonic development, it binds the canonical sequence 5'-ATGCAAAT-3'.
In ES cells, Oct4 often interacts with another TF, Sox2, which binds to an adjacent Sox motif 5'-CATTGTA-3'. Together, both TFs coregulate specific genes.
During the analysis of Oct4 or Sox2 binding peaks, the so-called SOCT motif is usually found, which is a composite motif encompassing both Oct and Sox motifs. (Figure 1)
The result's website is separated by sections, you can expand/collapse each section by clicking on it.
The section Results Summary contains the parameters specified and the number of input motifs and collections.
The section Clusters Summary shows for each cluster, the cluster size, the collections where they come from and the logo corresponding to the root motifs, this table is sortable by clicking on the header. At the last column of this table you can download the root motif.
The section Logo Forest shows for each cluster, a hierarchical tree, with the aligned logos at each branch. This tree is dynamic, by clicking on each node, you can collapse/expand the tree at will to manually control the cluster visualization. The red buttons at the end of each tree allow to change the motif orientation and show or hide the IC.
Can you manually reduce the cluster_1 to 6 non-redundant motifs?
The section Individual Motif View is a dynamic table with the information of each motif.
The section Individual Cluster View shows each cluster separatley and the order in which the motifs were incorporated. You can click on each node to select its corresponding branch-motif.
The section Heatmap View shows a matrix whit all the motifs compared against themselves. The color scale indicates a high (red) and low (yellow) similarity between the motifs. Each colored line at both sides indicates the cluster.
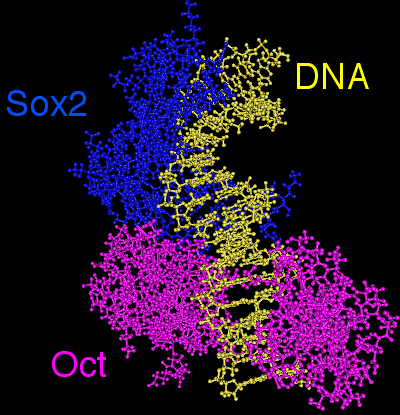
Figure 1. 3D model showing the cooperative binding between Sox2 and Oct4 TFs whose closely interact to bind DNA. Together, they recognize a composite motif called the SOCT motif (SOx+OCT).
Oct4 ChIP-seq discovered motifs table WITH thresholds
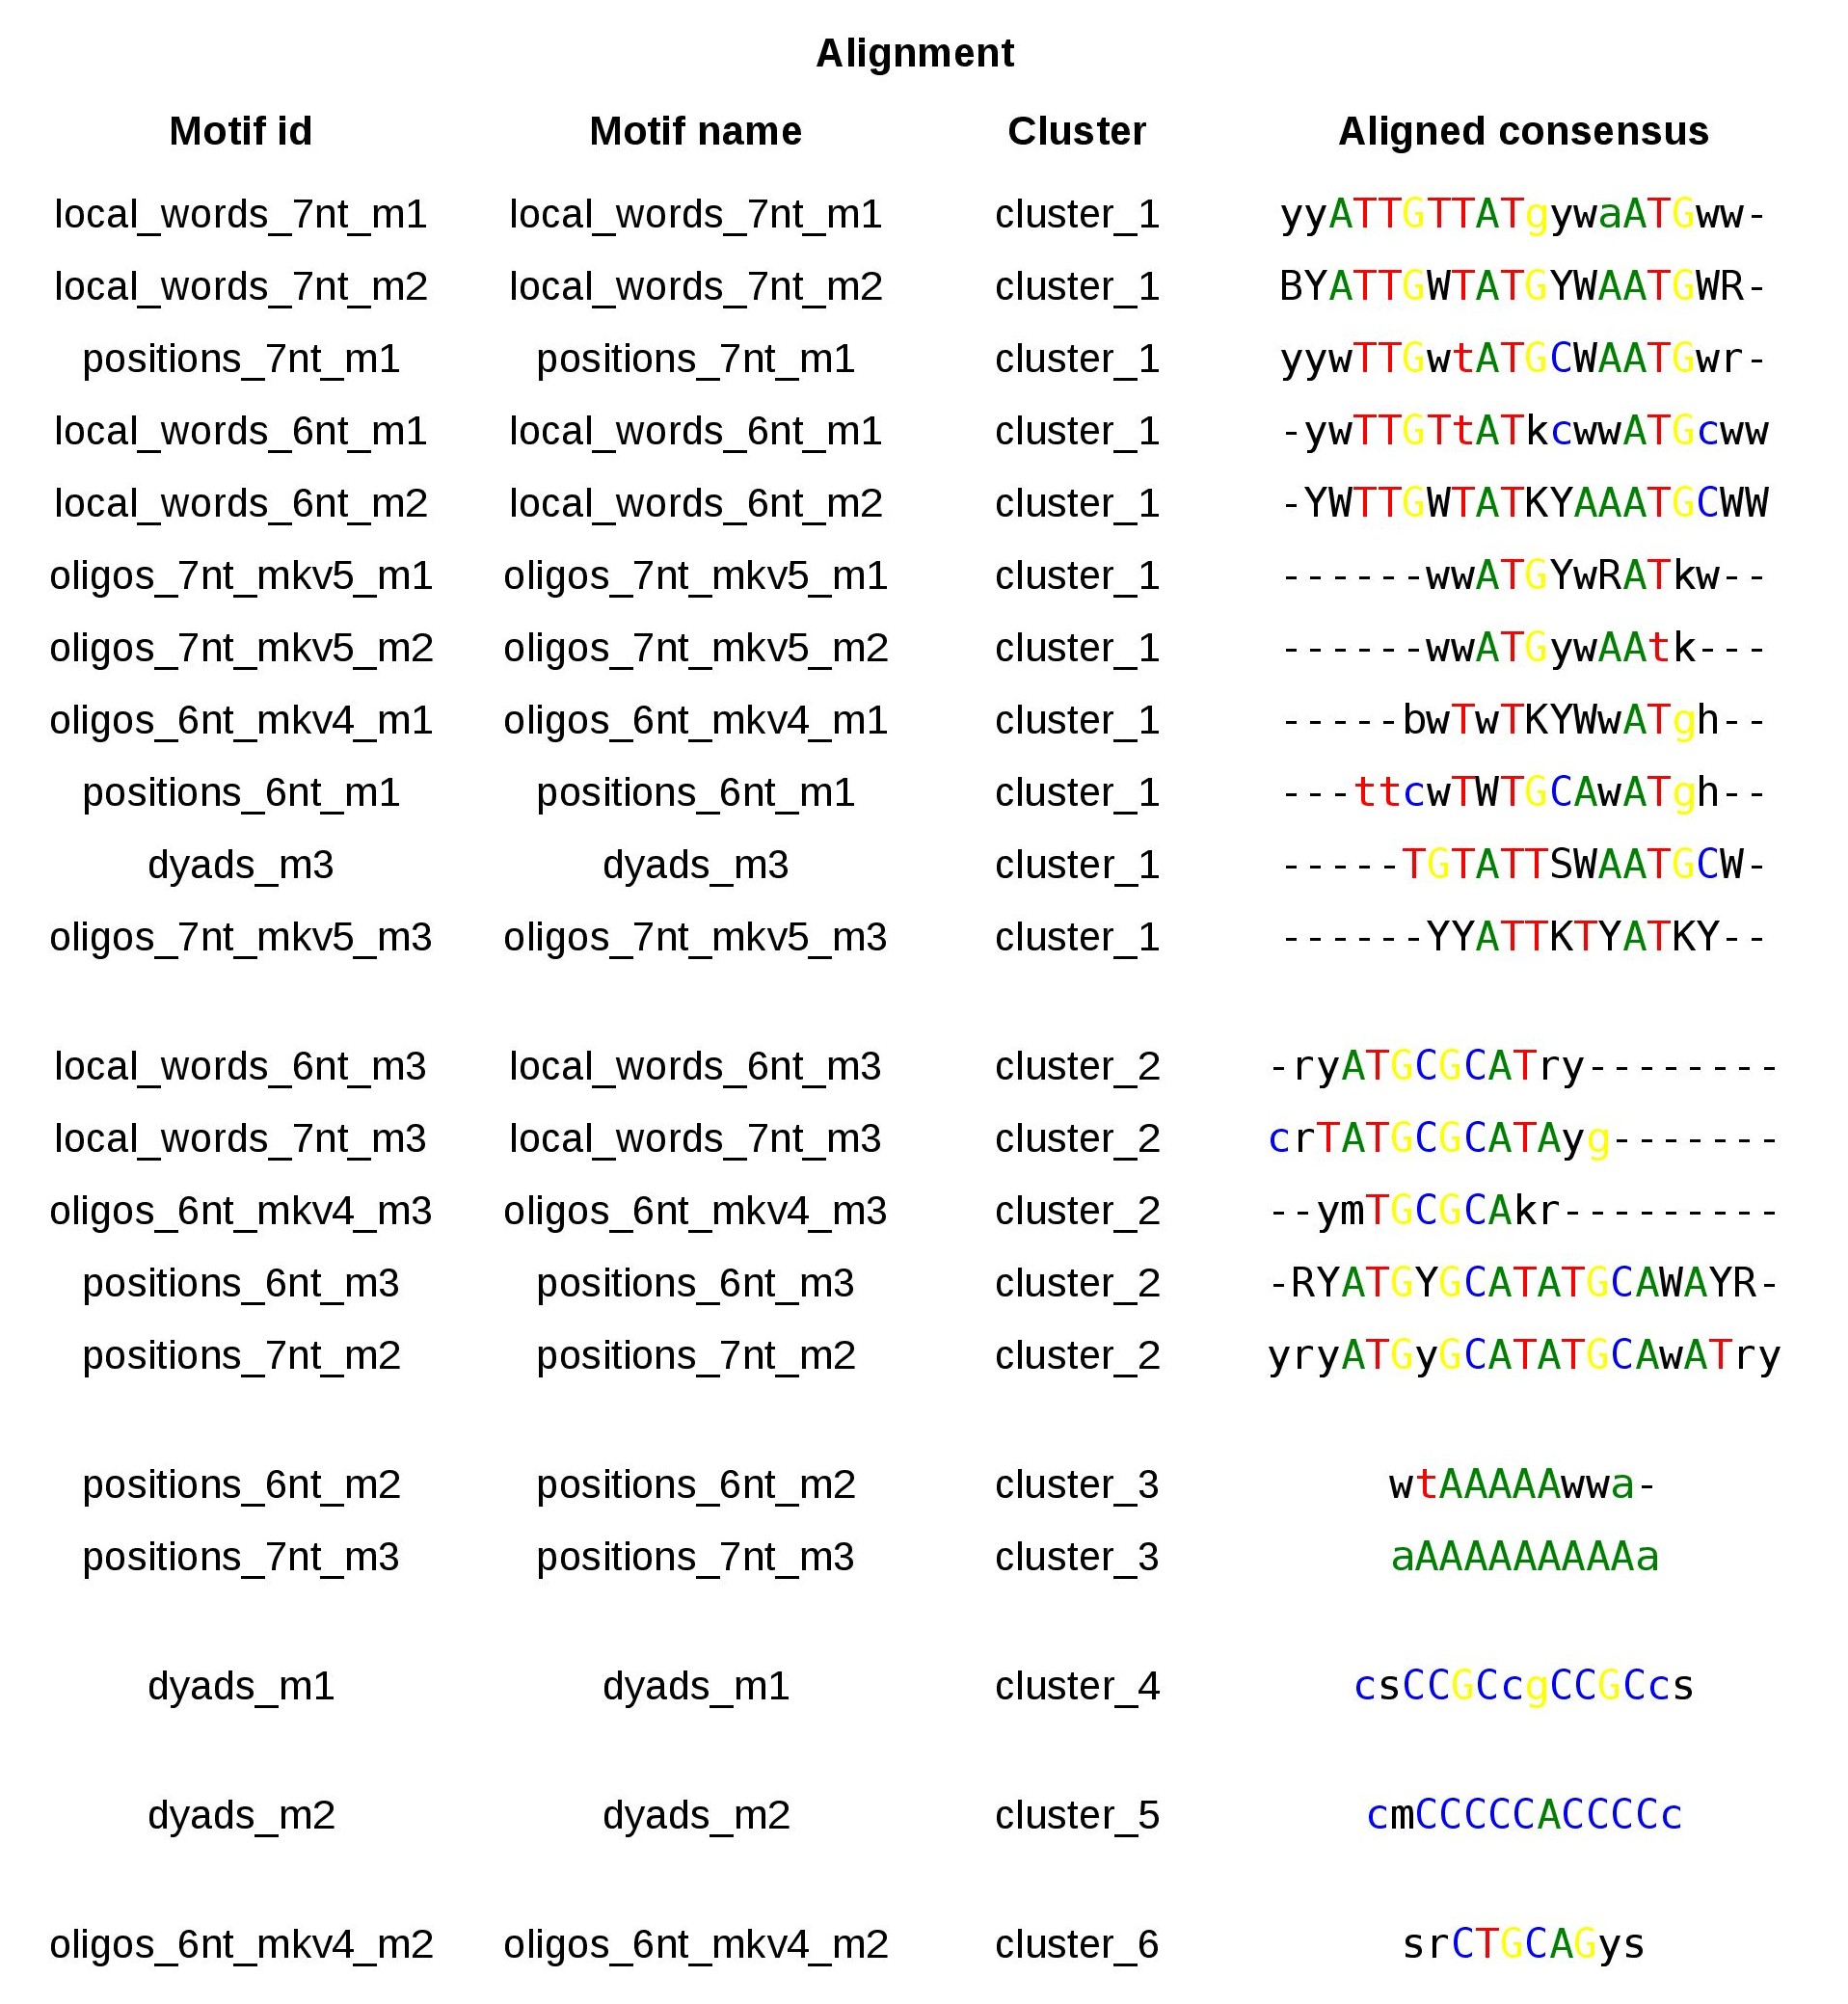
Figure 2. Table with the 21 motifs discovered by peak-motifs in the Oct4 ChIP-seq peaks andalized with matrix-clustering. Ncor<=0.4; cor>=0.6:
Cluster 1 logo tree
Figure 3. Logo tree of the cluster 1 found in the Oct4 ChIP-seq motifs. The hierarchical tree displays the logo aligment in both orientations. For each branch is calculated a branchwise-motif.
Cluster 1 branch-motifs table
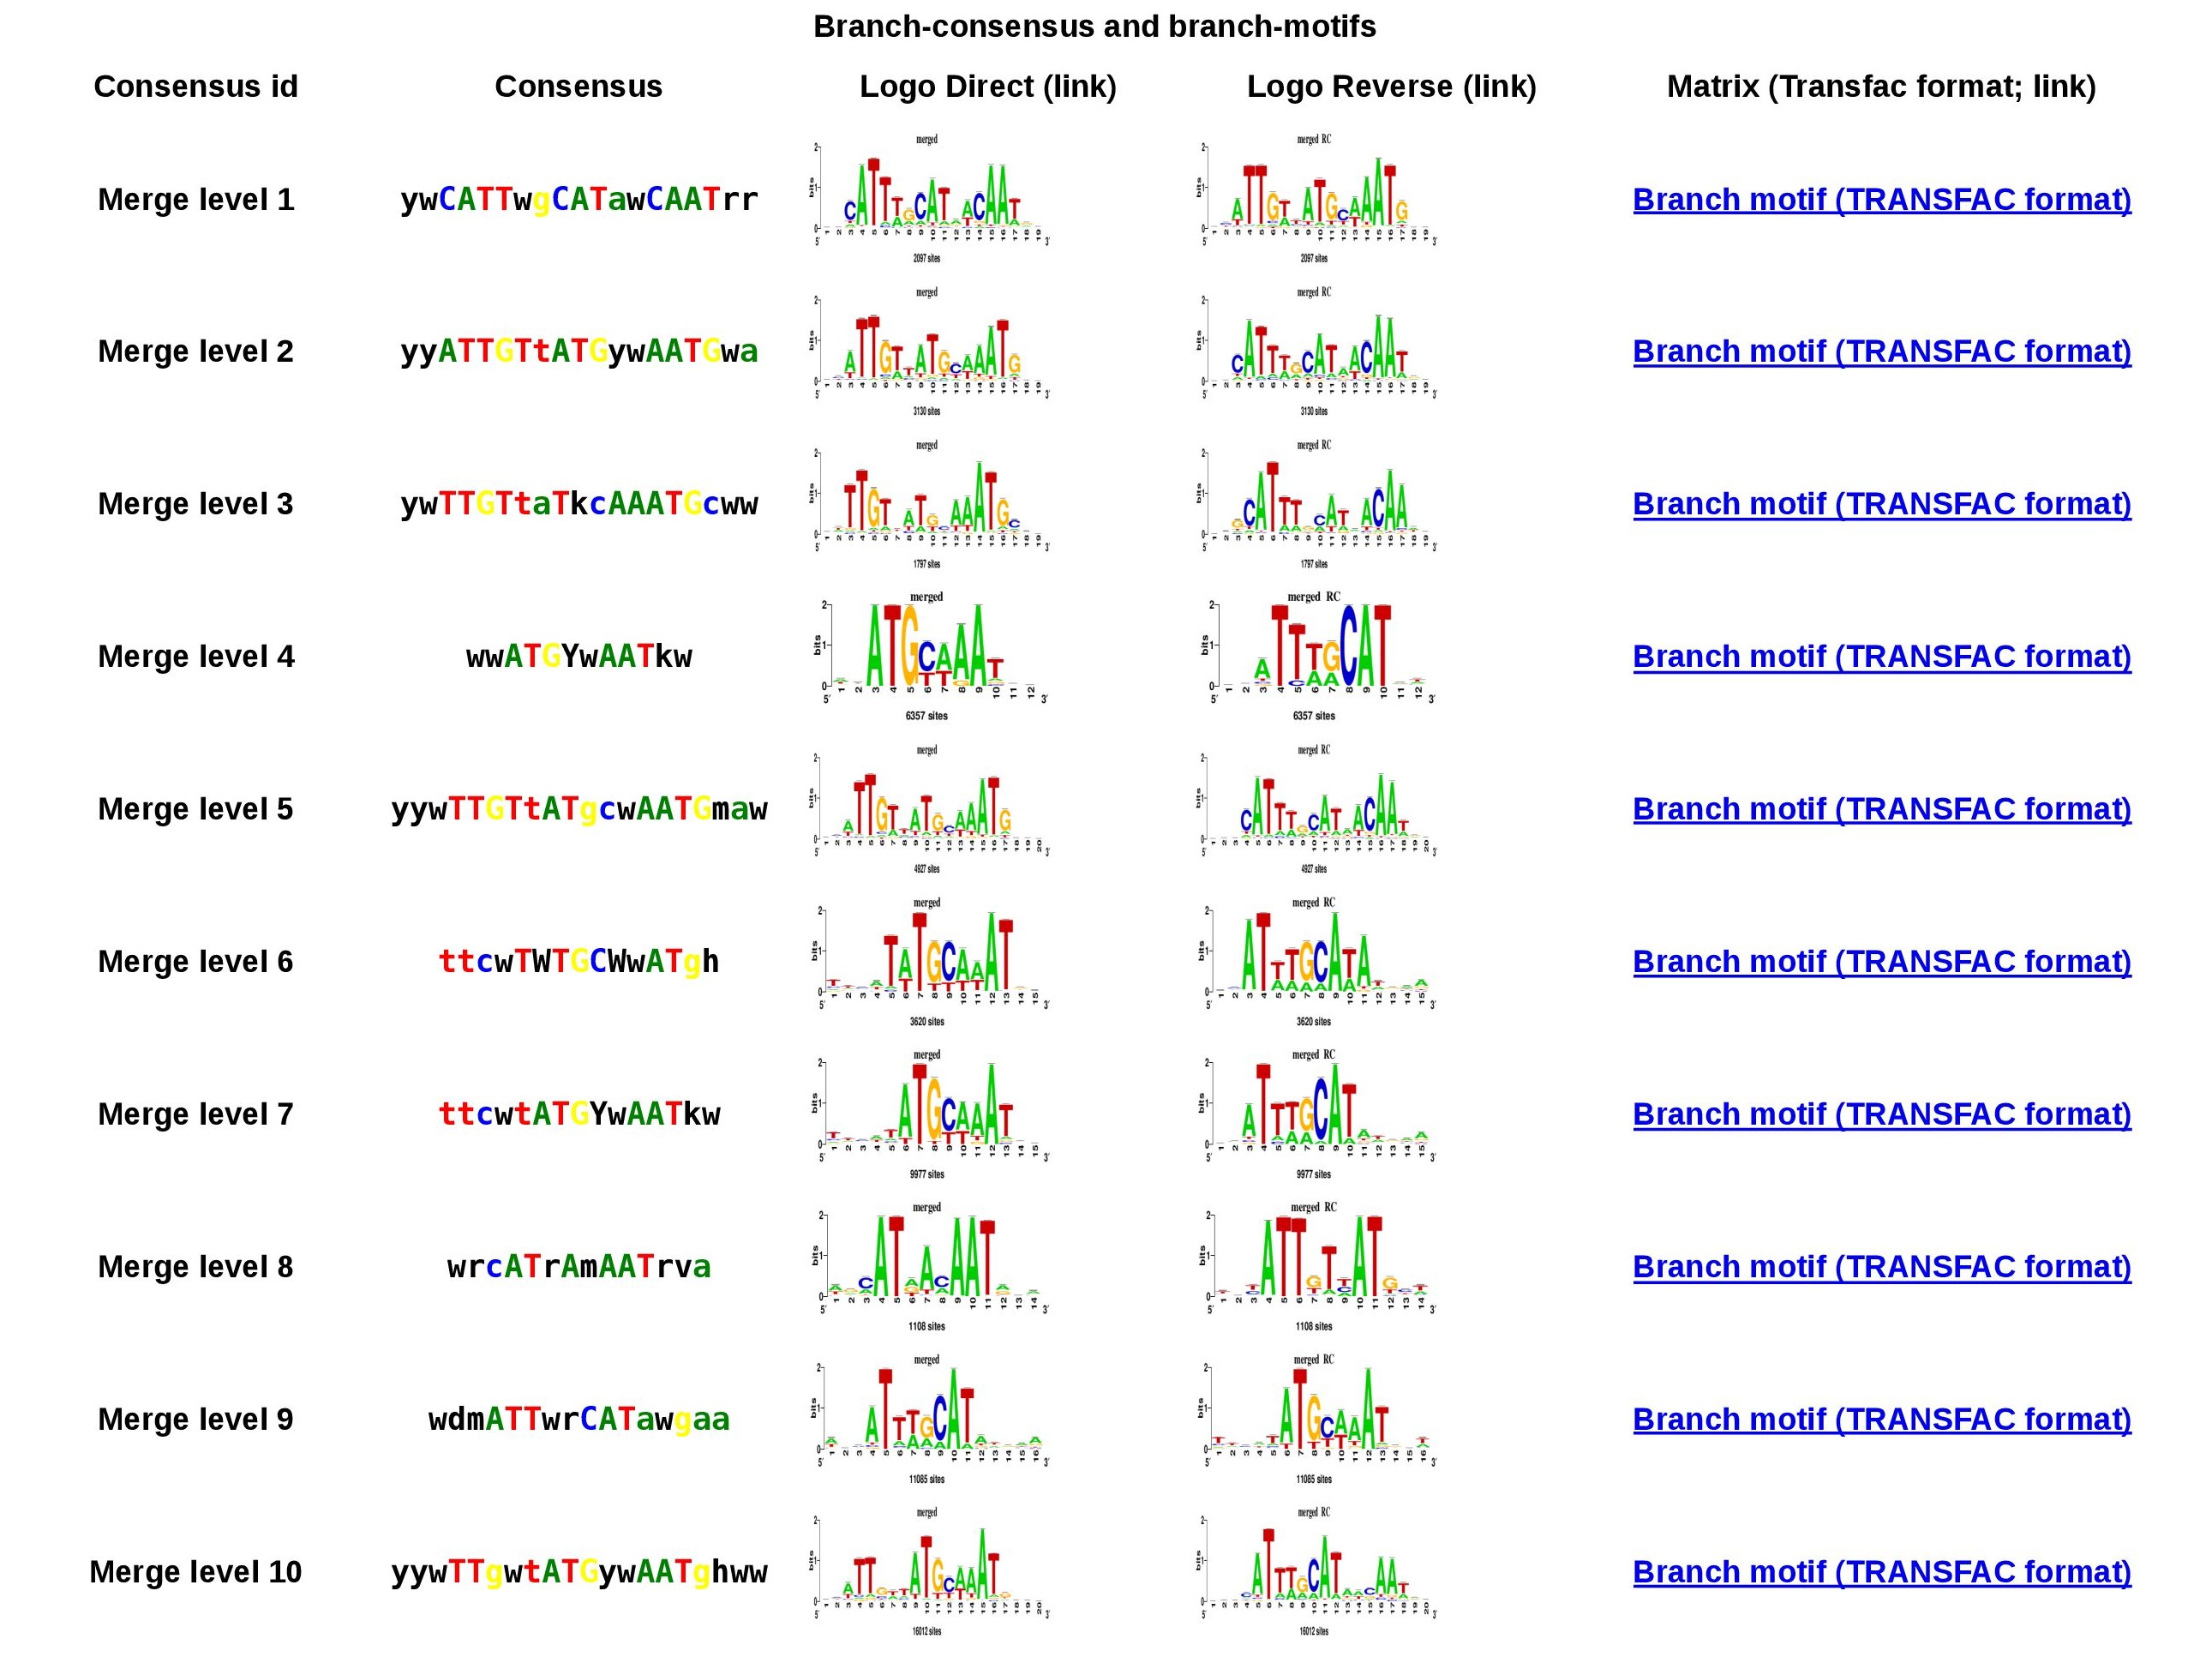
Figure 4. Branch-motif table for cluster 1. You can download the motif in TRANSFAC format or the logo in both orientations by clicking on them.
Logo Forest
Figure 5. Logo Forest with the 21 motifs discovered by peak-motifs in the Oct4 ChIP-seq peaks. Using a combination of values as threshold (cor = 0.6; Ncor = 0.4) these motif were separated in 6 different clusters and each one is displayed in a tree.
Branch-motif analysis
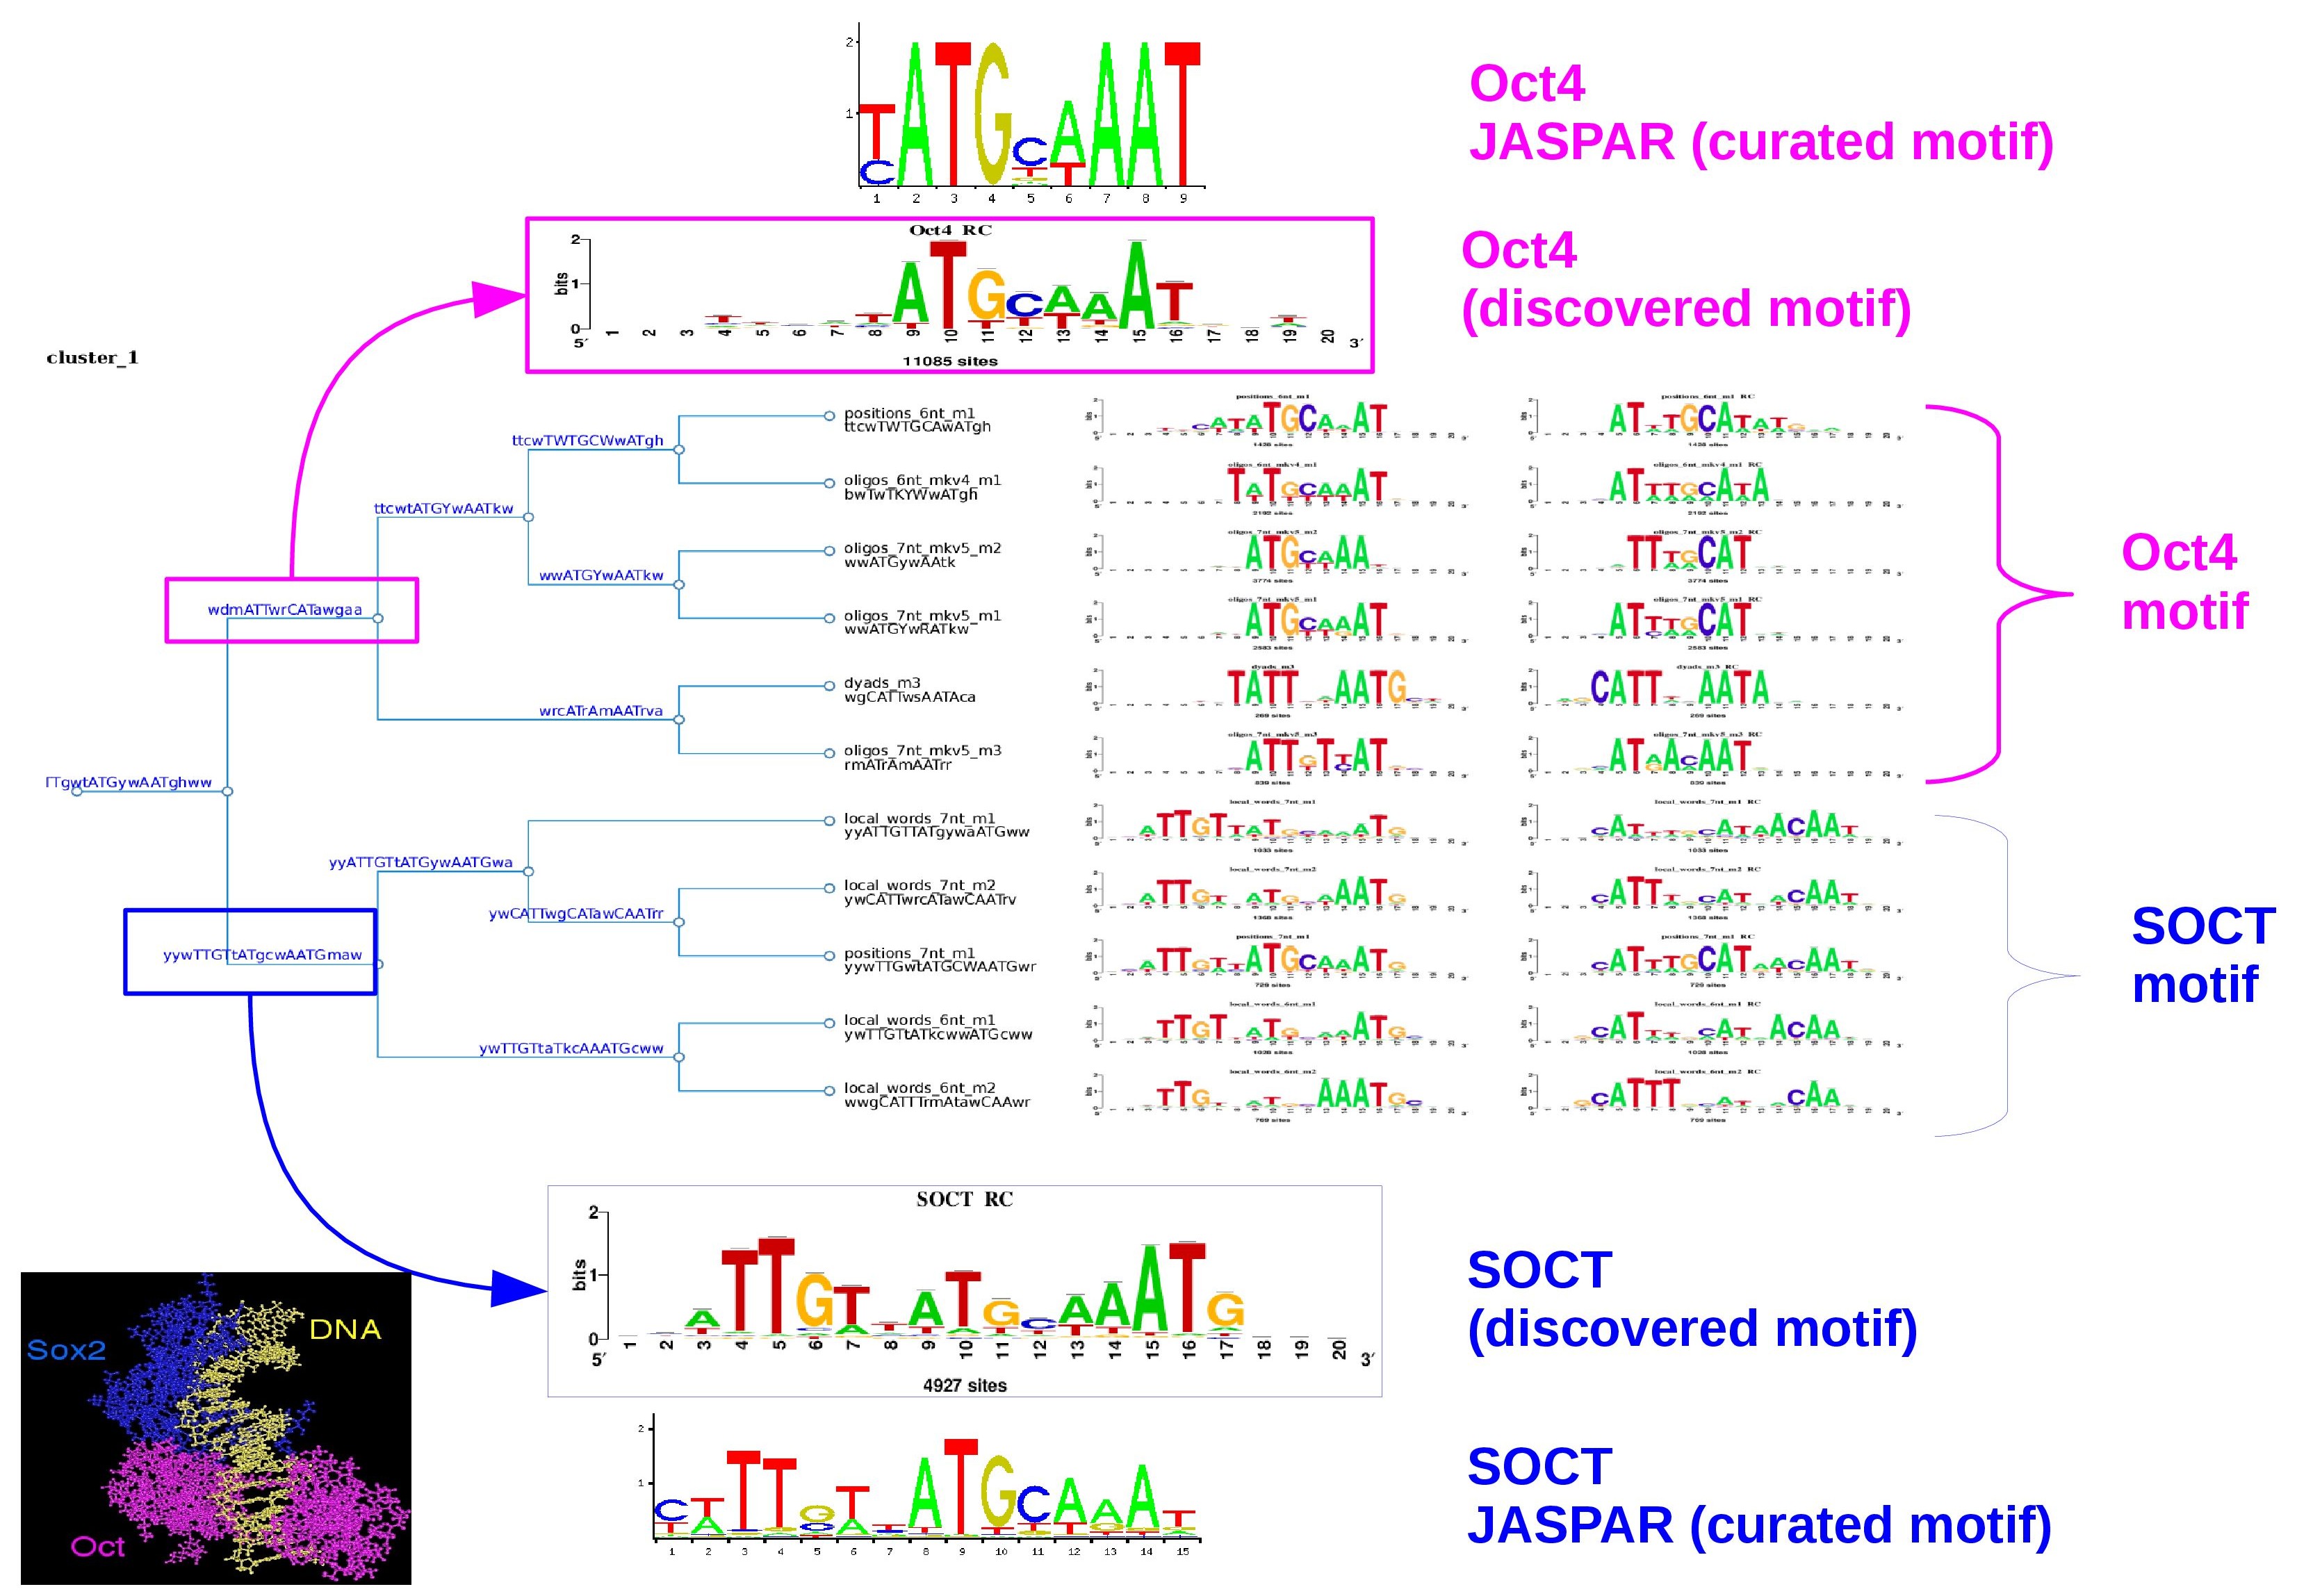
Figure 6. The logo tree of cluster one showing the branch-motifs
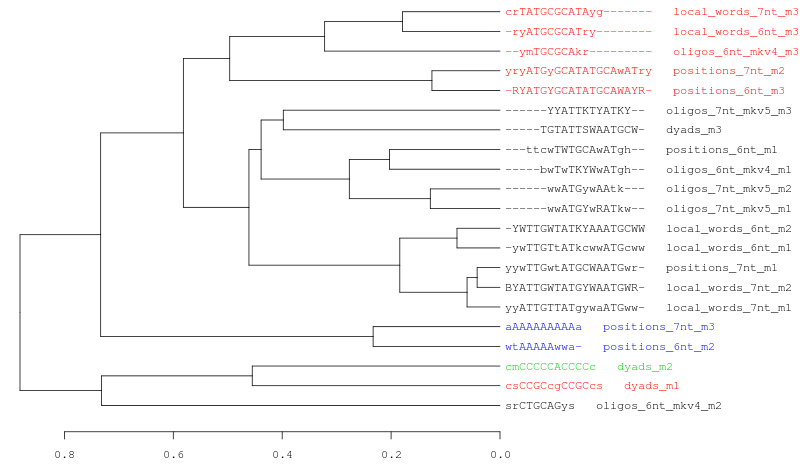
Consensus tree - Average method
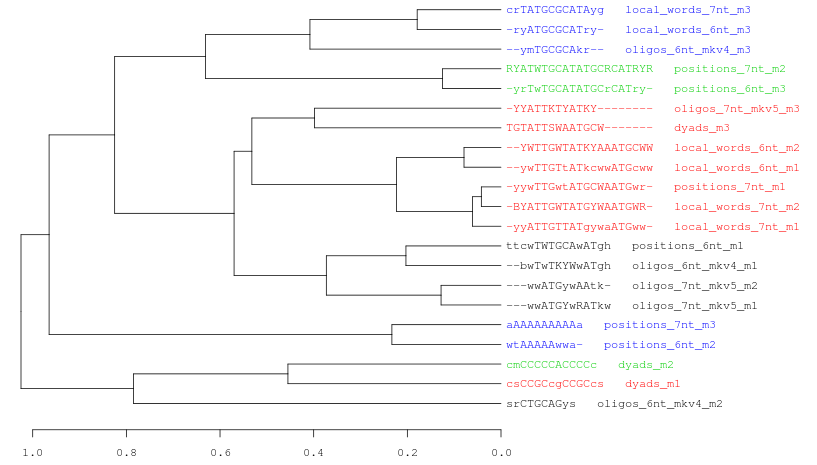
Consensus tree - Complete method
Consensus tree - Single method
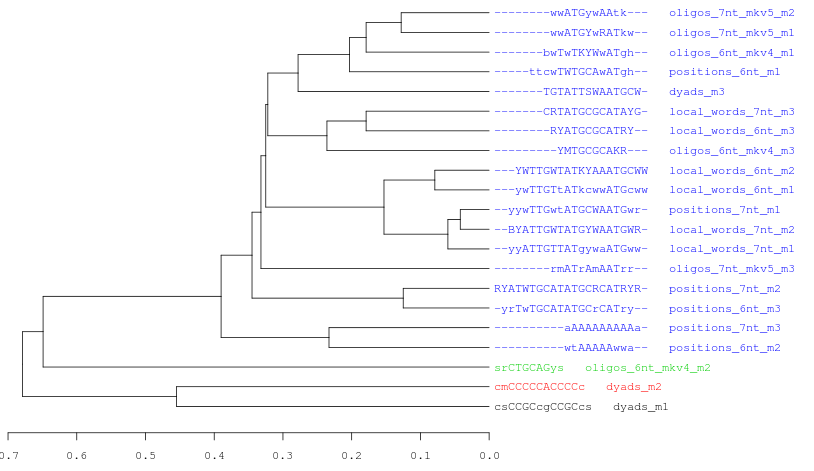
Figure 7. Three examples of consensus tree when we are using the same data (21 motifs discovered by peak-motifs in the Oct4 ChIP-seq) and the same threslhold values (cor >= 0.4; Ncor >= 0.6).
In this picture we only change the hierarchical clustering agglomeration rule. From top to down: average, complete, single linkage.Each cluster is represented with a different color. Observe how the number of clusters and the tree topology change depending on the selected method.Logo tree for cluster_1
Logo tree for cluster_3
Figure 8. Logo trees for cluster 1 and 3 which actually correspond to the SOCT and Oct4 motifs respectively. The threshold parameters used were: Ncor>=0.55 and cor>=0.625 .
Summary table
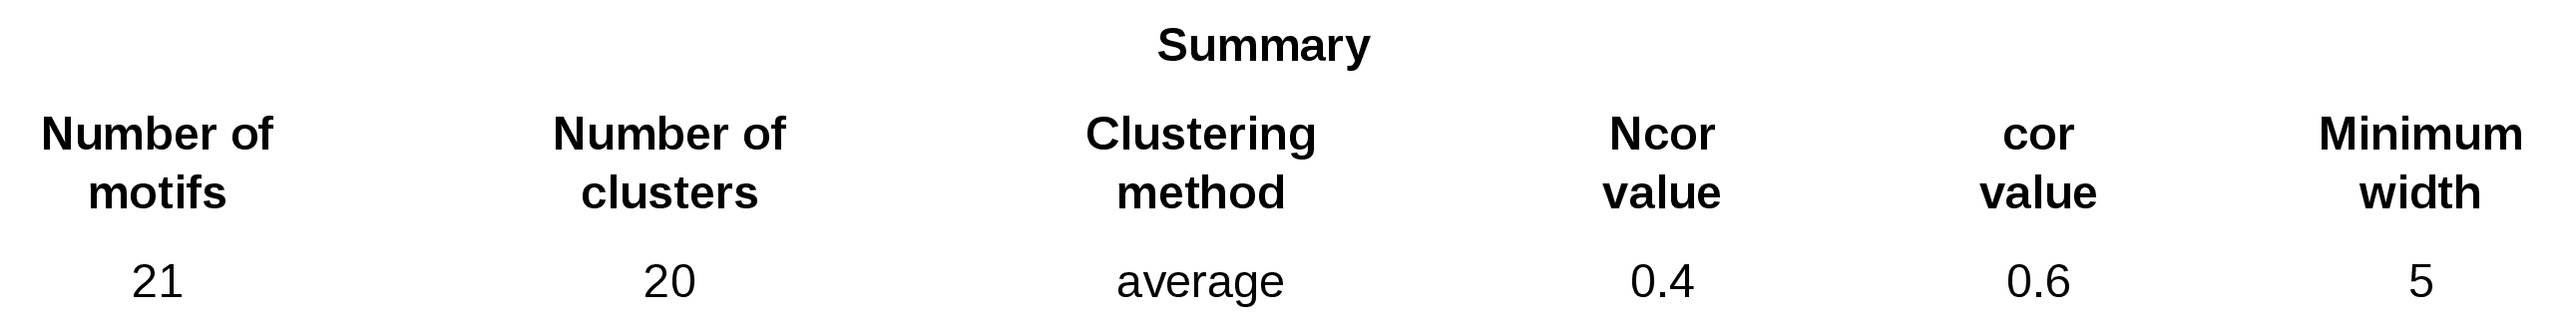
Figure 9. Summary table of an example of matrix-clustering results with randomized motifs
References
- Chen, X., Xu, H., Yuan, P., Fang, F., Huss, M., Vega, V. B., Wong, E., Orlov, Y. L., Zhang, W., Jiang, J., Loh, Y. H., Yeo, H. C., Yeo, Z. X., Narang, V., Govindarajan, K. R., Leong, B., Shahab, A., Ruan, Y., Bourque, G., Sung, W. K., Clarke, N. D., Wei, C. L. and Ng, H. H. (2008). Integration of external signaling pathways with the core transcriptional network in embryonic stem cells. Cell 133, 1106-17. [Pubmed 18555785].
- Thomas-Chollier, M., Herrmann, C., Defrance, M., Sand, O., Thieffry, D. and van Helden, J. (2011). RSAT peak-motifs: motif analysis in full-size ChIP-seq datasets Nucleic Acids Research doi:10.1093/nar/gkr1104, 9. [Open access]
- Mathelier, A., Zhao, X., Zhang, A. W., Parcy, F., Worsley-Hunt, R., Arenillas, D. J., Buchman, S., Chen, C.-y., Chou, A., Ienasescu, H., Lim, J., Shyr, C., Tan, G., Zhou, M., Lenhard, B., Sandelin, A. and Wasserman, W. W. JASPAR 2014: an extensively expanded and updated open-access database of transcription factor binding profiles Nucleic Acids Research, 2013 [Open access]
For suggestions please post an issue on GitHub or contact the email the RSAT team